Barbora Hinnerova
SOLUTIONS
7 MINS READ
Event Impact Analysis: How to Evaluate Large Events Using Location Data
See how location data reveals the economic and social impact of large-scale events. Gain insights for stakeholders with in-depth event analysis.

Large-scale events significantly impact their host cities. Understanding these effects through comprehensive analysis can help stakeholders make informed decisions, from local authorities to event organizers. This article delves into large-scale events' economic and social impacts, leveraging location data from various sources to provide a detailed overview.
Diverse Perspectives on Event Impact
Understanding the impact of a large-scale event requires considering the views of various stakeholders. Each group experiences the event differently, from local authorities managing infrastructure and public services to event organizers balancing financial viability and participant satisfaction. Sponsors seek visibility and customer engagement, while local residents seek minimal disruption and economic benefits. On the other hand, visitors contribute directly to the local economy through their spending. Analyzing these diverse perspectives helps paint a comprehensive picture of the event's impact.
Local Authorities: Understanding the impact on residents and infrastructure is crucial for local authorities. Events can strain transportation systems and public services, necessitating proactive planning and resource allocation.
Event Organizers: Event organizers must ensure the event's financial success while satisfying all participants, including visitors, sponsors, and local businesses. This involves strategic planning to attract attendees and sponsors and delivering a seamless experience.
Sponsors: Sponsors benefit from visibility and networking opportunities at large events. Choosing the right events to sponsor can enhance brand awareness and customer acquisition, making data-driven decisions critical.
Local Residents: The goal for residents is to participate in and enjoy the event without significant disruption to their daily lives. Balancing the benefits of increased economic activity with the potential for inconvenience is essential.
The Importance of Event Impact Analysis
Evaluating the impact of large-scale events through detailed analysis is crucial for understanding their multifaceted effects. This involves examining economic and social impacts, which can guide better planning and decision-making for future events.
Economic Impacts: Events bring significant economic benefits, but they also come with challenges and costs. Visitors' spending contributes to local economies, but the influx can strain resources and require additional infrastructure investment.
Social Impacts: Large events can alter the profile of local tourism. For example, during a festival, regular tourists might be displaced by festival-goers, changing the dynamics of the local tourism market. Understanding these shifts helps in planning and managing the event's impact.
What Can You Learn from Location Data About an Event
Location data provides a wealth of information about how an event impacts a city. By analyzing mobility patterns, we can identify which areas experience the highest foot traffic and which locations face congestion. Transaction data reveals spending behavior, helping pinpoint economic benefits and potential stress points for local businesses. This data also highlights key areas for security measures and helps optimize resource allocation. Overall, location data offers actionable insights to enhance event planning and management, ensuring a positive experience for all stakeholders.
Here are some specific use cases derived from our location analysis of an event:
Assessing the event's impact on different city areas, identifying those that benefit or face challenges.
Highlighting critical locations needing enhanced security.
Identifying prime spots for sponsor engagement and visibility.
Utilizing data to optimize logistics and resource allocation.
Location Data for Event Evaluation
As an example for our large-scale event evaluation, we will use the Karlovy Vary International Film Festival (KVIFF), the biggest film festival in the Czech Republic and the most prestigious in Central and Eastern Europe. KVIFF 2024 has just wrapped up, and we aim to highlight the importance of location data in its evaluation. While it is too early to have the numbers for 2024, let's review our analysis from last year. To thoroughly evaluate the impact of KVIFF 2023, we utilized a variety of data sources (see below). You can learn more about the available location datasets on our Data Marketplace.
Mastercard Transaction Data: Provides insights into spending patterns.
T-Mobile Mobility Data: Tracks visitor movement and density.
Data Appeal Points of Interest: Highlights key locations and their popularity.
Official KVIFF Points of Interest: Focuses on areas directly related to the festival.
For the purpose of further analysis, we created the following indexes from these datasets:
Credit Card Transactions Count Index
To understand the Mastercard data, we use an index that compares data to the average value in 2018 in the town/country/region (this comparative value has an index of 100). We analyzed data from June 1 to July 31, 2023, to explore differences before, during, and after the festival.
Transaction Amount Index
The festival's influence is noticeable across most Mastercard industries, especially in eating places. However, accommodation shows a surprisingly small impact during the festival.
Comparison of Normal Days and KVIFF Days
How and where is the town of Karlovy Vary most affected by the KVIFF festival? We compared normal days to KVIFF days to observe percentage increases.
Mobility Data Grids
The main metric from T-Mobile is the average number of people in a 4-hour interval within grid cells. We analyzed data from June 1 to July 31, 2023. The increase in the Transaction Count Index (15%) and Transaction Amount Index (16%) is relatively low, especially considering the significant rise in visitor numbers as indicated by T-Mobile Mobility data.
Event Analysis Use Cases Using Location Data
Let’s look at some use cases for an event of this scale and utilize all three datasets together (transactions from Mastercard, mobility from T-Mobile, and points of interest from Data Appeal) to evaluate an event. In this case, we will evaluate KVIFF 2023. After creating a CleverMaps account, you can interactively explore the following location insights (and many more) in our Data Stories.
How to Find the Most Interesting Locations for an Advertisement
Let's explore a use case where we want to find the most interesting locations for placing advertisements during KVIFF.
We will focus on grid cells:
With high transaction indices (Mastercard Transaction Amount).
With high population mobility (T-Mobile Average Number of People in Grid in 4-hour Interval).
Close to KVIFF Points of Interest (Distance).
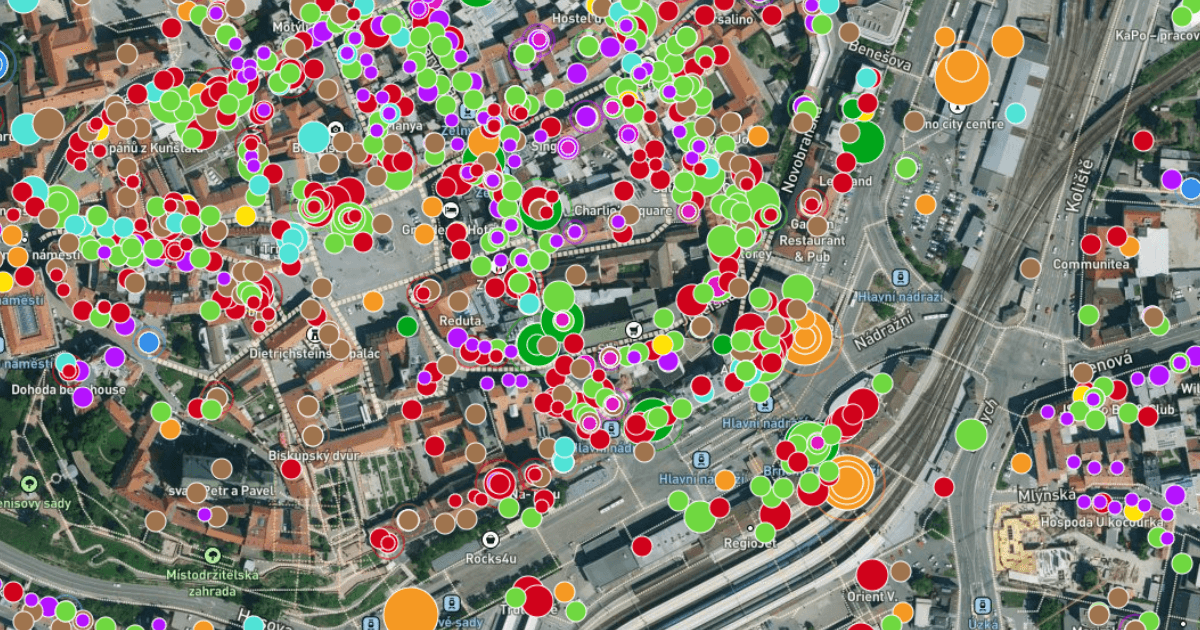
Additionally, we can pinpoint specific points of interest (POIs) to place our advertisements or supply our products. For example, if we are selling croissants, we would look for POIs where people have breakfast:
Café, Bistro, or Restaurant open in the morning (Open/Closed + Time Window + Category).
High average population mobility in the morning (Time Window).
We can refine our search by:
Changing the Mastercard index from All Retail to Eating Places (Industry).
Targeting places with a high number of people per type of business (People per 1 POI).
Selecting only the POIs with high popularity.
This approach ensures that our advertisements reach the most relevant and high-traffic locations, maximizing visibility and engagement.

Finding the most interesting locations for an advertisement using location data in CleverMaps Studio.
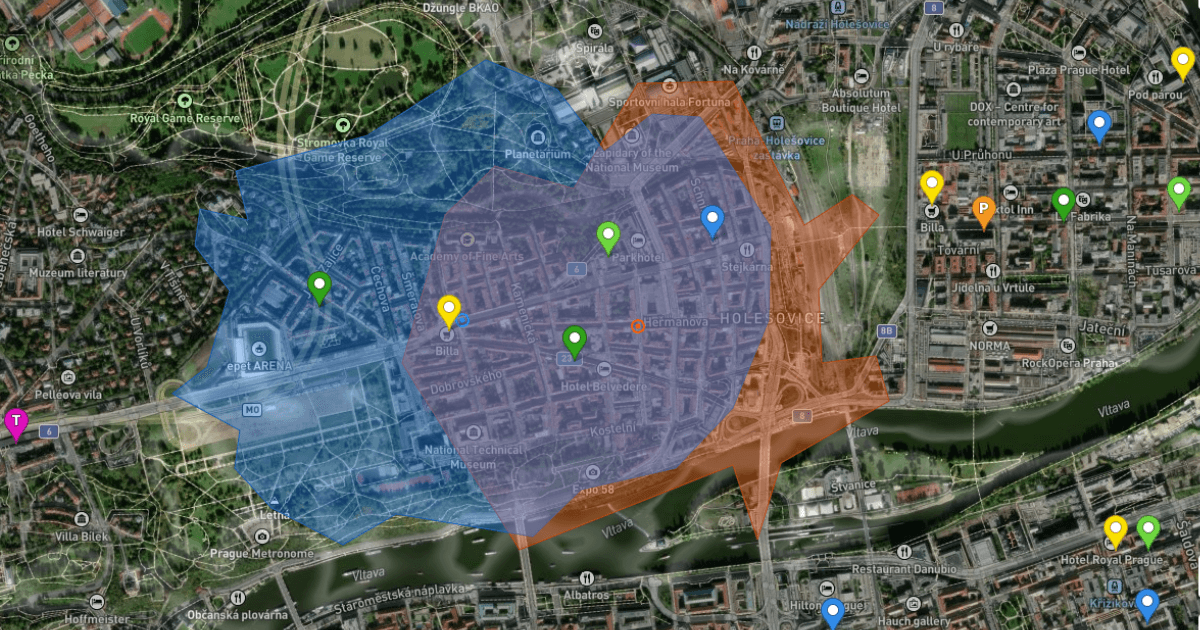
How to Find Critical Locations and Times for Ensuring Safety
If we work for a municipality or the local police department, we focus on different use cases, such as identifying critical locations and times for ensuring safety.
We would look for locations with the following:
There is a high number of people during the night (T-Mobile Average Number of People in Grid in 4-hour Interval + Time Window).
A high number of transactions (Mastercard Transaction Amount).
POIs open during the night (Open/Closed + Time Window).
This data helps ensure adequate safety measures are in place during peak times and in high-traffic areas.

Finding critical locations and times in the event area using location data in CleverMaps Studio.
How to Identify Localities with Untapped Business Potential
Combining data from Mastercard and T-Mobile can be highly effective when looking for localities with unrecognized commercial potential.
Using the metric Lost Potential (Average Number of People in Grid (T-Mobile) / Transaction Amount Index (Mastercard)), we can locate areas with high human traffic but low credit card transaction indices.
If the result is a high number, it indicates untapped business potential (many people around but few purchases made). Visualizing this data on a map helps pinpoint specific locations for targeted business opportunities.
We look for:
High Lost Potential:
High number of people.
Low transaction amount index.
Low Lost Potential:
High transaction amount index.
Low number of people.
This approach helps identify areas where business opportunities can be maximized by addressing the gap between human traffic and spending.

Finding locations for business opportunities in the event area using location data in CleverMaps Studio.
Evaluation of Large-Scale Events is Key for Everyone
Evaluating the Karlovy Vary International Film Festival (KVIFF) using location data provides crucial insights into the event's economic and social impacts. By utilizing Mastercard, T-Mobile, and Data Appeal data, stakeholders can understand visitor behavior, spending patterns, and mobility trends. This comprehensive analysis helps local authorities, event organizers, sponsors, and businesses make informed decisions to optimize planning, enhance security, and maximize economic benefits. As demonstrated, location data is an invaluable tool for ensuring large-scale events' success and positive impact.
Do you need a hand with your event’s location analysis? No problem, our team of geospatial experts is at your service. Just contact us.